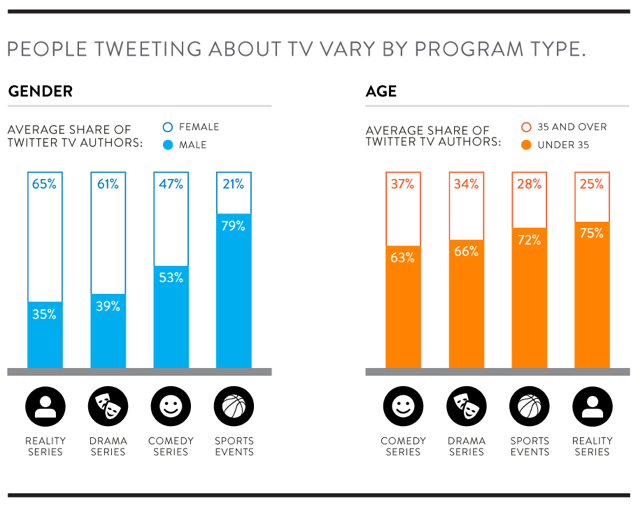
Nielsen expanded the information it provides for its Twitter TV Ratings service yesterday with the launch of demographic data. The new feature identifies the age and gender of those tweeting about TV shows and events in addition to those who see the tweets. Earlier Nielsen research found that the number of people who read tweets about TV shows outnumber those who create them by a 50-1 margin. In addition, the tweet “Viewers” represent a more demographically balanced profile than the tweet “Authors.”
“An initial analysis of Twitter TV demographics across 273 broadcast and cable program episodes reveals three important findings,” notes the Nielsen blog. “First, there’s a broad age and gender distribution across programming. Second, there are significant differences in the age and gender profiles of Tweeters across programming types. Most importantly, Twitter enables TV networks and advertisers to reach audiences beyond their core demographics.”
Nielsen is now categorizing Twitter users by the following age buckets: ages 13-17, 18-24, 18-49, 25-34, 35-54 and 55+.
“In the initial study of Twitter TV demographics, Nielsen found that Twitter TV Authors for the episodes analyzed ranged from 12 percent male to 92 percent male, which means the Twitter platform itself isn’t necessarily skewing more male or female, but each type of show being tweeted about attracts a different type of audience,” reports TechCrunch.
“On average, the Twitter TV Authors for Sports Events skewed 79 percent male, while Reality programs skewed 65 percent female,” the article explains. “Reality programs also had a younger mix of Twitter TV Authors: 75 percent were below the age of 35. Meanwhile, 63 percent of Authors were below 35 for Comedy programs.”
Nielsen says it is using a “modeled approach” to collecting info since Twitter does not require demographic data when users sign up. Models identify demographics based on features such as “the user’s first name, accounts it follows, details found in the bio/profile text, as well as text of the user’s recent tweets, handle and more,” adds TechCrunch.
The stats illustrated above are taken from a larger infographic available on the Nielsen blog.


No Comments Yet
You can be the first to comment!
Leave a comment
You must be logged in to post a comment.